How Much Money Do You Need to Retire Happy?
Use This Financial Guideline to Find Out: Understanding the 4% Rule
One of the biggest concerns many have when it comes to retirement planning is knowing how much money you’'ll need to live a comfortable and happy life.
While there's no one-size-fits-all answer, there is a simple financial guideline that can help you plan for a financially secure retirement.
It's called the 4% rule. Here’s how it works:
What is the 4% rule?
The 4% rule is a loose financial guideline that suggest you can withdraw 4% of your portfolio each year without ever running out of money.
The idea is that if your portfolio can average higher annual returns than the amount needed to be taken out to cover your expenses, then you’ve essentially reached financial freedom.
However, the 4% rule is not a guarantee. There’s a few things that you must keep in mind when using this guideline:
It’s based on the assumption that you have a well-diversified portfolio of investments that can generate an average annual return of around 7% to 8% (to account for the 4% being withdrawn and for the rate of inflation)
It's important to adjust your withdrawals for inflation to ensure that your purchasing power doesn't erode over time (for example, recent record high inflation has been between 5-8% for the last year)
Your actual retirement expenses may be higher or lower than the amount you've budgeted for, so it's essential to keep an eye on your spending and adjust your plan if needed.
How Much Will You Need To Retire Happy?
So now that you understand how the 4% works, you use it to calculate how much money you can expect to need to ensure a happy and stress-free retirement.
Add up your monthly expenses and multiply by 12 to get your yearly total.
Monthly Expenses x 12 Months = Total Annual Expenses
Then multiply your annual expenses by 25.
Annual Expenses x 25 = Your Retirement Goal
You can use this chart for reference:
Giving Yourself Wiggle Room
The 4% rule is widely used by financial planners everywhere as a rough rule of thumb for setting retirement goals, but the equation is still to be taken lightly.
Unprecedented economic times like what we’re seeing lately with this historic high inflation have a negative effect on this equation’s ability to predict necessary withdrawal rates.
If you want to give yourself more of a financial cushion and really ensure success throughout retirement, you can do the same math but only using 2-3% to calculate your total.
This math would assume that you’re withdrawing much less annually which would allow for your investments to continue growing and compounding over time.
Conclusion
We all dream of the ability to retire early and not having to worry about money. Now you can use this tool as a guideline to see a rough estimate of what you’ll need to retire happy.
For me personally, my first big goal is getting to $2.5 million invested. That would assume a $100k per year salary coming from nothing more than my portfolio.
Now that sounds like the dream situation and a ticket to financial freedom. I’m working hard to get there.
Thanks for reading, and be sure to subscribe for more if you haven’t already!
Mark Talks Markets - 4/17
Paid subscribers will have access to the special extended version of my weekly newsletter called Mark Talks Markets.
This edition gives you up-to-date stock market insights complete with easy-to-understand technical analysis of the major stock indexes and Bitcoin each week.
With this added value, paid subscribers have the tools they need to make informed decisions about their investments and stay ahead of the curve.
This week I’m allowing all of my subscribers access to this version FOR FREE!
I hope you enjoy.
A Look at the Charts
Every week I like to take a look at the stock charts for these 3 major markets:
The S&P 500, the Nasdaq, and Bitcoin.
These 3 charts carry so much weight in the financial world and a lot can be determined about investor sentiment and future expectations by simply keeping up-to-date with the trends.
Technical analysis and reading stock charts doesn’t need to be so complicated. I like to keep it very simple by using only 3 simple moving averages for reference (the 200-day, the 120-day, and the 50-day).
Let’s have a look at this week:
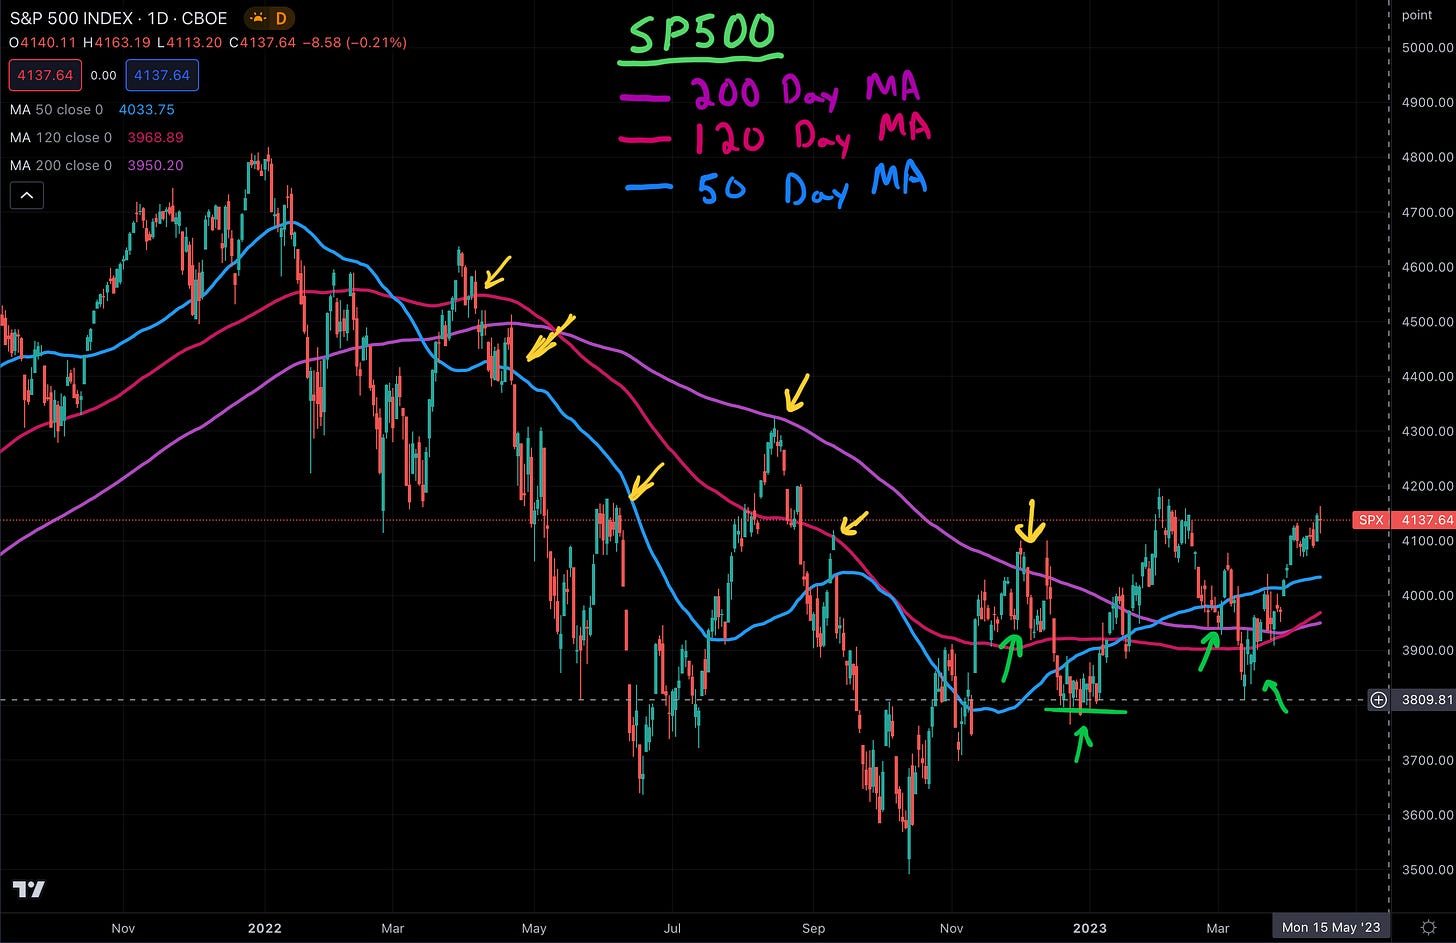
S&P 500
The S&P 500 has continued its comeback rally and after closing on Friday at 4137. It’s now +18% since hitting its 52-week low around the 3500 level back in October.
Despite still being -14% from its all time high, the S&P 500 is looking much better from a technical analysis point of view as well.
The index is now back well above its 200-day moving average, and its previous support level (~3800) held up strong on the last bit of market selling.
After being in a down trend and trading below the 200-day MA for over a year, it’s nice to see some positive momentum to the upside again.
3 Major levels I’m watching on the S&P 500 index:
~4200 This is the next major resistance level. A sustained break above this level could be signs of a more bullish move to the upside.
~3950 The 200-day moving average. A very important indicator that many traders and professional investors look to gauging shorter-term sentiment.
~3800 Previous support level that held up strong during the last sell-off. A break below could indicate more bearish signals in the short term.
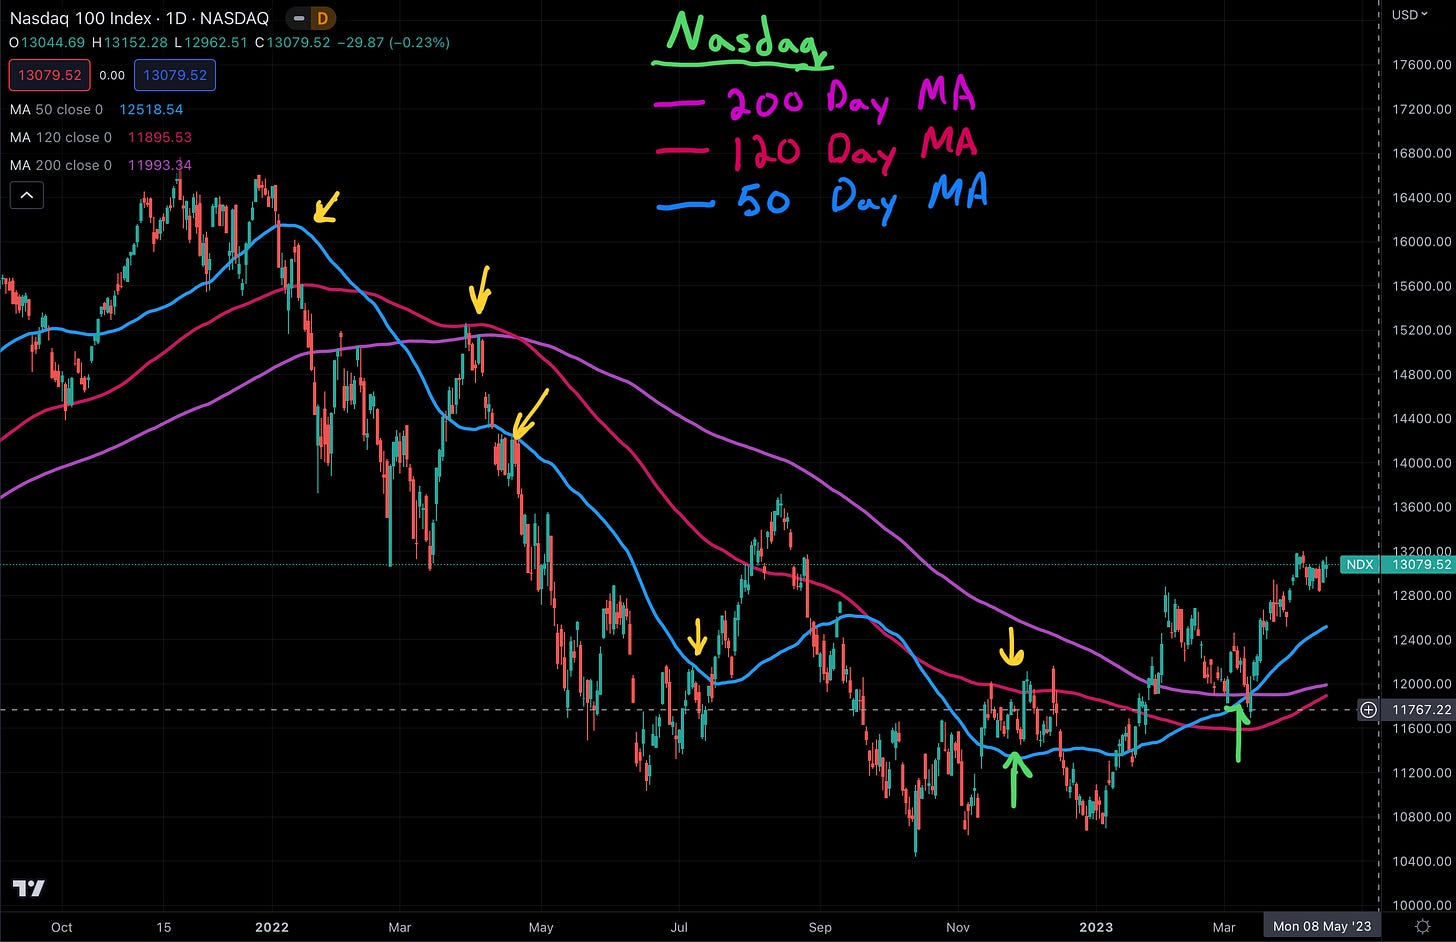
Nasdaq
The Nasdaq has also continued its comeback rally and after closing on Friday at 12,123. It’s now +24% since hitting its 52-week low around the 10,500 level back in October.
Despite still being -21% from its all time high, the Nasdaq is looking much better from a technical analysis point of view as well.
The index is now back well above its 200-day moving average, and its previous support level (~12,000) held up strong on the last bit of market selling.
After being in a down trend and trading below the 200-day MA for over a year, it’s nice to see some positive momentum to the upside again. Especially as the moire tech-heavy Nasdaq has been much harder in this current bear market than the more diversified S&P 500.
3 Major levels I’m watching on the Nasdaq index:
~13,800 This is the next major resistance level. A sustained break above this level could be signs of a more bullish move to the upside.
~12,000 The 200-day moving average. A very important indicator that many traders and professional investors look to gauging shorter-term sentiment.
~11,500 If the 200-day MA were to fail to hold as support, this would be the next level I’d expect a support to form.
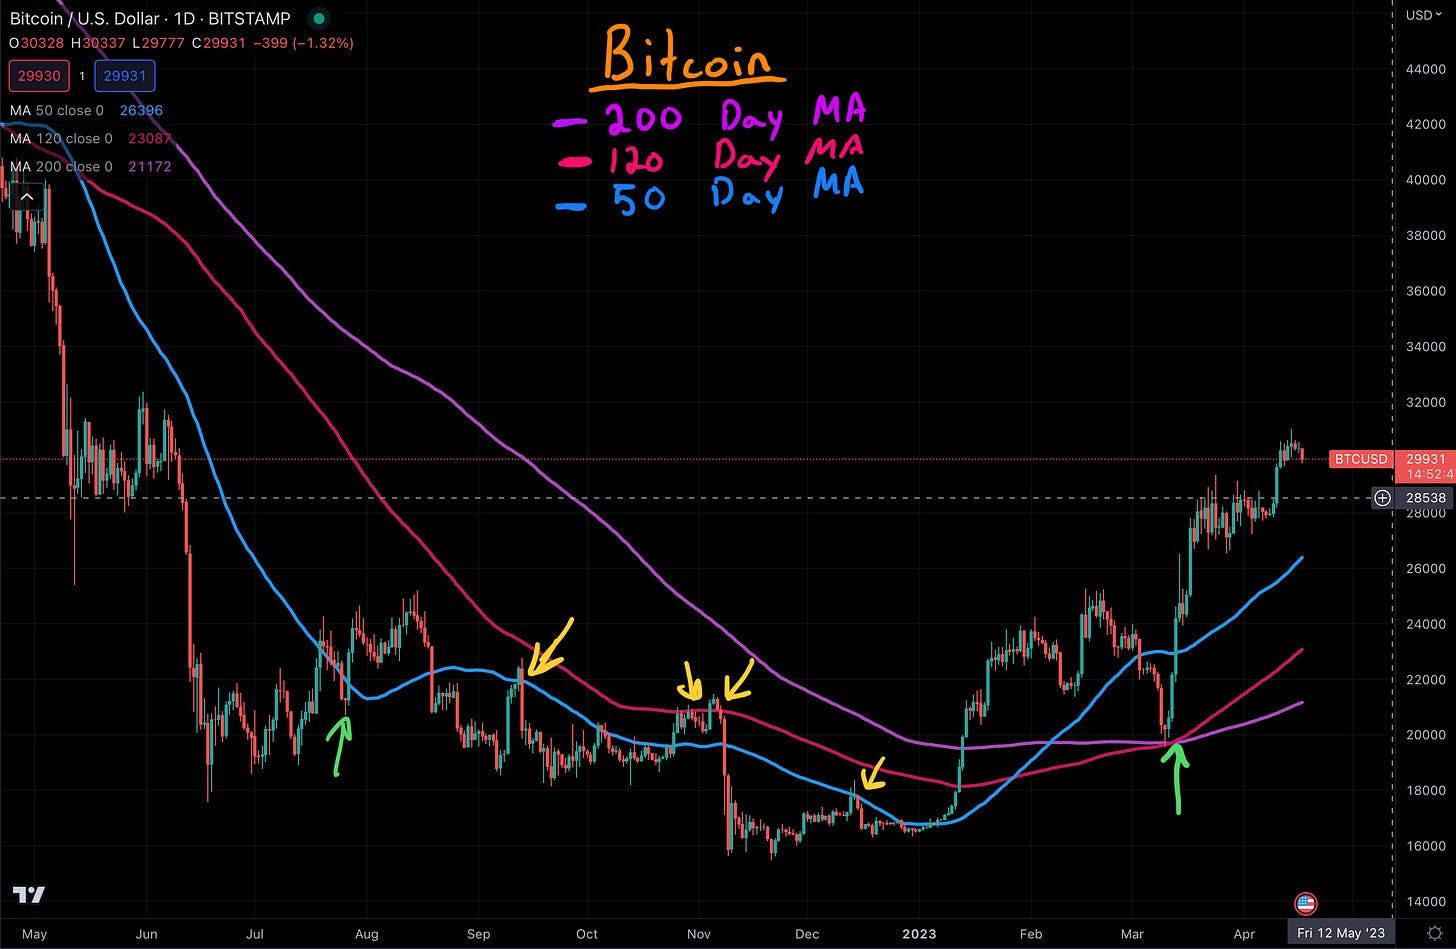
Bitcoin
Bitcoin has had a remarkable turnaround so far in 2023. After hitting a new 52-week low last November around $15,500, the crypto has since gone +92% as it’s once again trading above the $30,000 level.
Bitcoin hasn’t traded above $30,000 since May of 2022 and it’ll be interesting to see if this extraordinary rally will continue. Though even after the massive gains seen this month, Bitcoin is still -56% from its all time high.
3 Major levels I’m watching on Bitcoin:
~$32,000 This is the next major resistance level for Bitcoin. A sustained break above this level could be signs of a much more bullish move to the upside. If it can sustain a break above $32,000 then it could potentially continue its rally all the way back to $40,000 (the next definitive resistance after)
~$26,500 The 50-day moving average. As Bitcoin has been making massive moves to the upside, the asset may need to cool off before charging any higher. Selling pressure would likely see a test of the 50-day MA as its the next closest support level.
~$20,000 This is a crucial and extremely important psychological level for Bitcoin. I suspect it to be a major test of support for any drastic turn around in sentiment causing a sell-off.
Earnings On Tap for This Week
Here’s a look at all of the companies who will be reporting earnings this week:
Thanks for reading! I’m excited to see what this week in the financial markets is gonna bring.
I’ll be watching everything closely and will be ready to break it all down again for you in next week’s edition of Mark Talks Money.
Be sure to subscribe if you haven't already and consider becoming a paid subscriber if you want to continue receiving simplified technical analysis and up-to-date stock market insights.


Big week ahead!!
Retirement can get here sooner than you think with the proper action plan!